
Forecasting Stock Prices from the Limit Order Book using Convolutional Neural Networks
18 Apr 2019 | Finance HS
고빈도 거래의 가격을 예측을 CNN을 통해 시도한 논문“Forecasting Stock Prices from the Limit Order Book using Convolutional Neural Networks”에 대해 이야기해보도록 하겠습니다.
Abstract
**1. vast amount of transactions
- deep learning methodology
- Convolutional Neural Networks
- high-frequency
- time-series
- order book of financial**
**exchanges
- 4 millions limit order**
Introduction
- Mathematical Model 은 volatility, trend, real value of assets 을 prediction 하게 해준다.
-
하지만, 이러한 Model의 parameters은 observation에 따른 handcrafted 라는 문제가 있다.
-
또한, 시장에서 발생하는 irrational behavior를 설명하지 못한다.
-
large scaled transaction 이 허용됨에 따라, handcrafted 문제를 해결하는 ML & DL 방법이 제시되고 있는 추세이다.
-
large-scale high-frequency limit order data 를 통해, future mid-price를 예측한다.
- Deep learning network는 Convolutional Neural Network(CNN)를 사용한다.
High Frequency Limit Order Data
$p^{b}(t)$ : bid price at time $t$
$p^{a}(t)$ : ask price at time $t$
$v^{b}(t)$ : bid volumes at time $t$
$v^{a}(t)$ : ask volumes at time $t$
$p^{b}(t) > p^{a}(t)$ : highest available buy price (^) lowest available sell price
they annihilate executing the orders and exchanging the traded assets between the investors.
OHLC(Open-High-Low-Close) resampling to ensure specific number of values exist for each time $t$
Convolutional Neural Network for Financial Data
Time period : 1st to the 14th ~ June 2010
(only business days are included)
10 days for 5 different stocks ( 4 millions datasets)
Normalizing the vector of values for feeding the Neural
networks ( orgin datasets exceed the range of
activation function )
$\sigma\bar{x}, \bar{x}$ is calculated from previous day’s data.
mid price is calculated from
mean between the best bid price and best ask price at
time t
$p_{k} > p_{t+k}$ 작은 기간의 변화는 매우 작거나 noise가 존재할 수 가능성이 있다. 이에 따라, 작은 변화마저 upward downward 의 movement로 classify될 수 있다.
$m_{b}(t) = \sum_{i=0}^k p_{t-i}$
$m_{a}(t) = \sum_{i=0}^k p_{t+i}$
작은 기간의 변화는 매우 작거나 noise가 존재할 수 있으니, i 기간만큼의 이전, 이후 기간의 mid price의 평균을 사용한다.
threshold $\alpha$ 는 상향 또는 하향으로 간주되기 위해 발생해야하는 최소 가격 변화로 설정된다.
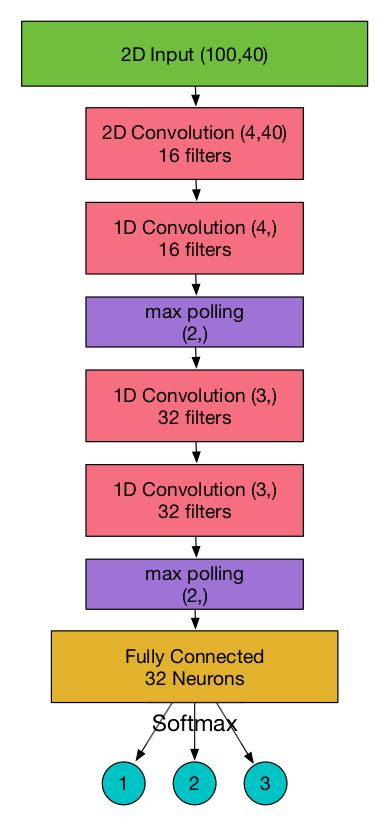
- 100 : number of datasets ( 100 recent limit order)
- 40 : number of each dataset
- S : number of used filters
- D : filter size
-
N : number of input channels
- loss function : minimizing the categorical cross entropy loss
- optimizer : learn the parameters W of the model is gradient descent
- activation function : Lecky Relu
- Batch size : 16
- Train same model for 3 different prediction horizon “k”
- max pooling : return 2 max values within each vector
Overall network used and Experiment Results
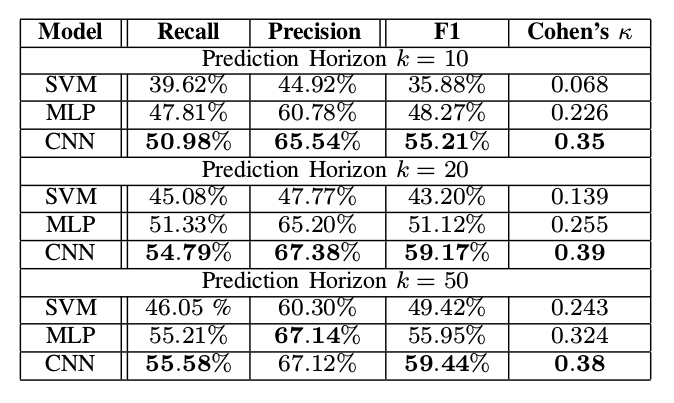
Conclusion
다른 horizon $k$ 를 적용함에 따라, 고빈도 거래의 limit order book의 데이터의 미래 mid price를 예측하려고 하였으며, Linear SVMs과 MLP(Multi layer perceptron)보다 좋은 결과를 보였다.
시사점 :
- 주식시장말고, 다른 고빈도 거래 시장은 어떨까?
- 가상 화폐 시장이 보다 기회가 많지 않을까
- CNN 말고 다른 모델은 무엇이 있을까? (sequence를 잡아낼 수 있는 RNN: 당연히 시도가 있었다.)
- input data 를 normalizing 한 것은,activation function의 range 내에 위치하게 해주기 위함이였다. feature engineering의 개념으로, 고빈도 거래의 price, volumes 뿐만 아니라, 다른 informative 한 소스가 무엇이 있을까? (OCPL 데이터간의 관계..?)
- 주식을 5개만 사용했는데, 전체 주식을 사용해야 하지 않을까?
고빈도 거래의 가격을 예측을 CNN을 통해 시도한 논문“Forecasting Stock Prices from the Limit Order Book using Convolutional Neural Networks”에 대해 이야기해보도록 하겠습니다.
Abstract
**1. vast amount of transactions
- deep learning methodology
- Convolutional Neural Networks
- high-frequency
- time-series
- order book of financial** **exchanges
- 4 millions limit order**
Introduction
- Mathematical Model 은 volatility, trend, real value of assets 을 prediction 하게 해준다.
-
하지만, 이러한 Model의 parameters은 observation에 따른 handcrafted 라는 문제가 있다.
-
또한, 시장에서 발생하는 irrational behavior를 설명하지 못한다.
-
large scaled transaction 이 허용됨에 따라, handcrafted 문제를 해결하는 ML & DL 방법이 제시되고 있는 추세이다.
-
large-scale high-frequency limit order data 를 통해, future mid-price를 예측한다.
- Deep learning network는 Convolutional Neural Network(CNN)를 사용한다.
High Frequency Limit Order Data
$p^{b}(t)$ : bid price at time $t$
$p^{a}(t)$ : ask price at time $t$
$v^{b}(t)$ : bid volumes at time $t$
$v^{a}(t)$ : ask volumes at time $t$
$p^{b}(t) > p^{a}(t)$ : highest available buy price (^) lowest available sell price they annihilate executing the orders and exchanging the traded assets between the investors.
OHLC(Open-High-Low-Close) resampling to ensure specific number of values exist for each time $t$
Convolutional Neural Network for Financial Data
Time period : 1st to the 14th ~ June 2010 (only business days are included)
10 days for 5 different stocks ( 4 millions datasets)
Normalizing the vector of values for feeding the Neural networks ( orgin datasets exceed the range of activation function )
$\sigma\bar{x}, \bar{x}$ is calculated from previous day’s data.
mid price is calculated from mean between the best bid price and best ask price at time t
$p_{k} > p_{t+k}$ 작은 기간의 변화는 매우 작거나 noise가 존재할 수 가능성이 있다. 이에 따라, 작은 변화마저 upward downward 의 movement로 classify될 수 있다.
$m_{b}(t) = \sum_{i=0}^k p_{t-i}$
$m_{a}(t) = \sum_{i=0}^k p_{t+i}$
작은 기간의 변화는 매우 작거나 noise가 존재할 수 있으니, i 기간만큼의 이전, 이후 기간의 mid price의 평균을 사용한다.
threshold $\alpha$ 는 상향 또는 하향으로 간주되기 위해 발생해야하는 최소 가격 변화로 설정된다.
- 100 : number of datasets ( 100 recent limit order)
- 40 : number of each dataset
- S : number of used filters
- D : filter size
-
N : number of input channels
- loss function : minimizing the categorical cross entropy loss
- optimizer : learn the parameters W of the model is gradient descent
- activation function : Lecky Relu
- Batch size : 16
- Train same model for 3 different prediction horizon “k”
- max pooling : return 2 max values within each vector
Overall network used and Experiment Results
Conclusion
다른 horizon $k$ 를 적용함에 따라, 고빈도 거래의 limit order book의 데이터의 미래 mid price를 예측하려고 하였으며, Linear SVMs과 MLP(Multi layer perceptron)보다 좋은 결과를 보였다.
시사점 :
- 주식시장말고, 다른 고빈도 거래 시장은 어떨까?
- 가상 화폐 시장이 보다 기회가 많지 않을까
- CNN 말고 다른 모델은 무엇이 있을까? (sequence를 잡아낼 수 있는 RNN: 당연히 시도가 있었다.)
- input data 를 normalizing 한 것은,activation function의 range 내에 위치하게 해주기 위함이였다. feature engineering의 개념으로, 고빈도 거래의 price, volumes 뿐만 아니라, 다른 informative 한 소스가 무엇이 있을까? (OCPL 데이터간의 관계..?)
- 주식을 5개만 사용했는데, 전체 주식을 사용해야 하지 않을까?
Comments